
Welcome to my Oxford Club Technical Pattern Profits review!
Disclaimer: There are affiliate links on this page. This means that if you click through and purchase anything, I might earn a commission for the introduction with no extra cost to you. In no event will we be liable for any loss or damage including without limitation, indirect or consequential loss or damage, or any loss or damage whatsoever arising from loss of data or profits arising out of, or in connection with, the use of this website.
Through this website you are able to link to other websites which are not under the control of stockalertsreviewed.com. We have no control over the nature, content and availability of those sites. The inclusion of any links does not necessarily imply a recommendation or endorse the views expressed within them.
Limited Time Deal to Purchase Nate Bear’s Profit Surge Trader ASAP HERE
You can also watch a full interview with Nathan Bear discussing the Profit Surge Trader system here.
***********************************************************************************************************************************
Investing Wizard Who Turned $37K Into $2.7M in Just 4 Years Makes His Next Big Move
 |
He started from nothing and became a multimillionaire…
He’s now one of the most sought-after trading experts…
Yet he operates 858 miles from Wall Street.
And now, he’s revealing his #1 favorite strategy that targets MASSIVE weekly profits with just one stock ticker.
************************************************************************************************************************
Recently, I became a member of the The Oxford Club Chairman Circle. This allows me access to all of the Oxford Club’s trading and investment programs.
I have already reviewed a couple of the Oxford Club services (Nicholas Vardy Swing Trader and The Insider Alerts). Both are excellent programs.
Be sure to come and join our Stock Alerts Reviewed Facebook group where we share tons of reviews and polls with our 5,000+ members!
FB Group and Free eBooks
Check out my Facebook Group for a community of traders that are interested in stock alerts services.
If you are interested in learning an options trading strategy with a 95% win rate……check out my store of free eBooks!
Bullseye Trades: Best Alerts Service

Every Monday at the market open, Jeff sends you his weekly Bullseye Trade.
2022 has been AMAZING for these Bullseye Trades!
(+50% to 300% per week in my experience)
LEARN HOW TO WIN 90% OF YOU TRADES IN 90 SECONDS!
>> CLICK HERE TO LEARN MORE! <<

What is The Oxford Club?
The Oxford Club has been around for over 30 years. They have a focus on building wealth in the market with long, medium and short term investment/trading programs.
The Oxford Club has more than 157,000 Members worldwide in over 130 countries. William Bonner, the founder of The Agora, is also one of the founders of The Oxford Club, which officially started as the Passport Club in 1989. The Club took its current name in 1991 to reflect our combination of old-world sensibility and modern technology.
Today, they offer a plethora of investment newsletters ranging from short term trading to long term holds.
Oxford Club Technical Pattern Profits Review: Marc Lichtenfeld

Marc Lichtenfeld is the advisor of Technical Pattern Profits.
Marc is a former Wall Street analyst and business journalist. He had made appearances on several TV and radio shows that feature business and investment news, such as CNBC, Fox Business, and Bloomberg Radio.
He has extensive experience as a financial analyst, trader, and a fund manager. With this background, he has been invited to speak at different investment conferences in the world. That proved his expertise in the matter.
He authored some great books such as You Don’t Have To Drive An Uber In Retirement, and the bestselling book Get Rich with Dividends.
Bullseye Trades: Best Alerts Service
Every Monday at the market open, Jeff sends you his weekly Bullseye Trade.
2022 has been AMAZING for these Bullseye Trades!
(+50% to 300% per week in my experience)
Technical Pattern Profits Review: The Power Channel
Marc preaches one technical pattern…….
The “Power Channel”…
He seems convinced that this is the most reliable technical chart pattern that he has ever used. It is pretty much the only trading strategy he uses in Technical Pattern Profits.
It’s interesting how simple the Power Channel is. It is based on just simple support and resistance. It is pretty clear when to buy and when to sell….
If you are new to trading then the Power Channel may be a new idea to you. However, most experienced traders will already use it to trade. I guarantee it.
What Do You Get With Technical Pattern Profits?
Marc tells you exactly what to do in each trade he sends to you.
You can take advantage of the Power Channels by purchasing either the stock or the options.
I know that not everyone is familiar with options and that many investors have an unnecessary aversion to them. But trading options gives you incredible leverage to maximize your gains when stocks surge.
As a subscriber, you hear from Marc about once a week. He sends the trade ideas via SMS and email.
There are trades only on days that have the greatest profit opportunity and lowest risk. For the most part, the aim is to be in and out of a position within 24 hours. But in certain instances, the hold times may be a little longer.
Marc lets you know exactly what the action to take is. And tells you the “buy up to” price and exit strategy.
It’s also important to know that it will involve both stocks and options.
You also get access to a couple of training videos about how Marc trades and how to trade options.
Limited Time Deal to Purchase Nate Bear’s Profit Surge Trader ASAP HERE
You can also watch a full interview with Nathan Bear discussing the Profit Surge Trader system here.
***********************************************************************************************************************************
Investing Wizard Who Turned $37K Into $2.7M in Just 4 Years Makes His Next Big Move
| |
He started from nothing and became a multimillionaire…
He’s now one of the most sought-after trading experts…
Yet he operates 858 miles from Wall Street.
And now, he’s revealing his #1 favorite strategy that targets MASSIVE weekly profits with just one stock ticker.
************************************************************************************************************************
Marc’s Power Channel Explained
Marc started to notice the pattern that he calls the Power Channel quite early during his decades in the market. It is very simple! If you can draw two straight lines then you can identify a Power Channel.
Here is an example…..
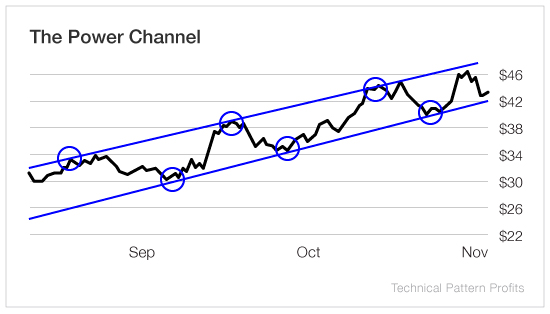
The example above shows how you can connect chart lows (support) and highs (resistance) with two lines to predict buy and sell areas. Basically, buy low sell high.
Marc finds stocks that are trading in these channel formations and alerts you when he does. He also adds a couple of other indicators to screen for the very best Power Channel trades.
LEARN HOW TO WIN 90% OF YOU TRADES IN 90 SECONDS!
>> CLICK HERE TO LEARN MORE! <<
Bullseye Trades: Best Alerts Service
Every Monday at the market open, Jeff sends you his weekly Bullseye Trade.
2022 has been AMAZING for these Bullseye Trades!
(+50% to 300% per week in my experience)
Three Power Channel Plays
The aim is to buy the stock (or option) when the stock is trading near the bottom of the channel. As the stock rises and approaches the top of the channel, you’ll want to consider selling your position.
About 20 years ago, Marc had the privilege of spending the day with stochastics’ inventor, George Lane. He told him that “Stochastics are the only thing you need to trade the market.” He may have been exaggerating a bit, but Marc has used them ever since. And they work especially well with Power Channels.
Stochastics are a momentum indicator and are especially useful in signaling that momentum is changing. That is critical for us when analyzing channels. If a stock is coming down to the bottom of a channel, we want to know that momentum is changing for the better and that the stock is likely to bounce off the channel line.
I also use the TTM Squeeze for this momentum indicator.
Conversely, if a stock is at the top of the channel but isn’t showing that momentum is shifting to the downside, we may hang on and see if it breaks out of the channel. If stochastics are turning lower, we exit the trade.
It’s important to keep in mind that the Power Channel is the dominant technical tool Marc uses. He won’t sell a stock in the middle of a channel just because the stochastics are turning lower. But at the top of a channel, if stochastics are overbought and turning lower, Marc will recommend that you sell.
Limited Time Deal to Purchase Nate Bear’s Profit Surge Trader ASAP HERE
You can also watch a full interview with Nathan Bear discussing the Profit Surge Trader system here.
***********************************************************************************************************************************
Investing Wizard Who Turned $37K Into $2.7M in Just 4 Years Makes His Next Big Move
| |
He started from nothing and became a multimillionaire…
He’s now one of the most sought-after trading experts…
Yet he operates 858 miles from Wall Street.
And now, he’s revealing his #1 favorite strategy that targets MASSIVE weekly profits with just one stock ticker.
************************************************************************************************************************
Stochastics have a reading of zero to 100. Anything below 20 is considered oversold, and anything above 80 is overbought. When the black line crosses above the red line in oversold territory, that’s a buy signal. When it crosses below in the overbought area, that’s a sell signal.
Now that you know how Power Channels work, let me show you three example trades that Marc has alerted. These are just some examples for you to see the style and detail of the alerts.
Trade 1: $CARR
Carrier Global Corporation (NYSE: CARR) provides heating, ventilating and air conditioning (HVAC), refrigeration, fire, security, and building automation technologies worldwide.
Action to Take: Buy Carrier Global Corporation (NYSE: CARR) at the market. Speculators can consider the March $40 calls between the bid and the ask. Our target price on this trade is $45.
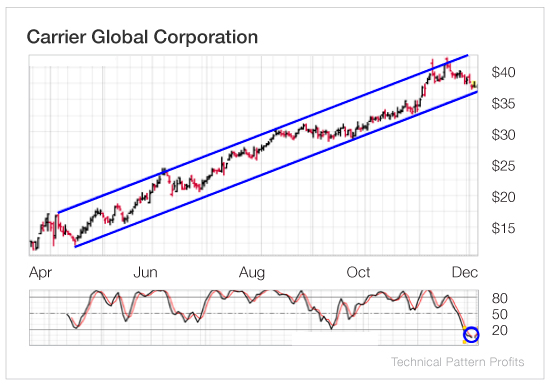
Shortly after this trade was alerted, the price dropped slightly below the bottom line of the channel. Three months later the stock is still trading below the channel and the price target was never reached.
Trade 2: $AMWD
American Woodmark Corporation (Nasdaq:AMWD) manufactures and distributes kitchen, bath, and home organization products for the remodelling and new home construction markets in the United States.
Action to take: Buy American Woodmark (Nasdaq: AMWD) between the bid and the ask — for $94 or lower. Options traders can buy the AMWD January 15 $95 call between the bid and the ask.
This is a small cap stock so it may move a little. Don’t pay more than $94 and do not buy the stock or calls at the market. Only buy them between the bid and the ask so that you don’t pay too much.
My price target on the stock is $120.
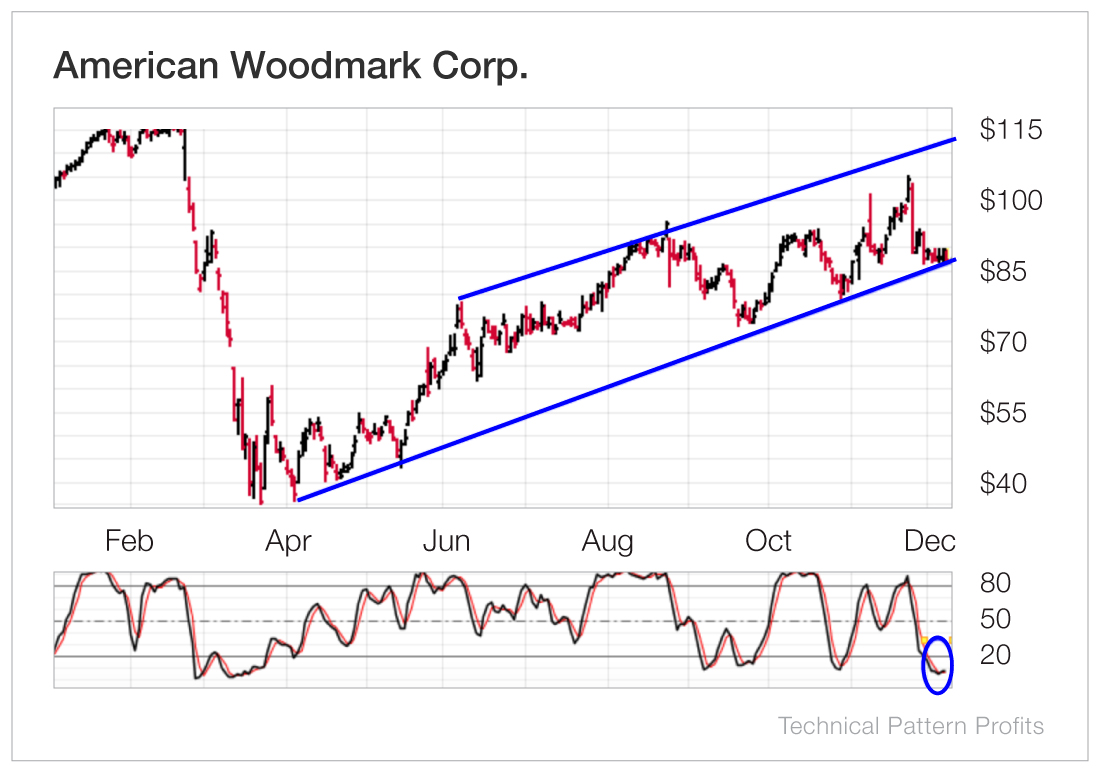
Unfortunately, the stock price continued just going sideways over the next few months and the channel was broken. It is unlikely that investors will have taken a loss in this trade, but the channel did not continue.
Limited Time Deal to Purchase Nate Bear’s Profit Surge Trader ASAP HERE
You can also watch a full interview with Nathan Bear discussing the Profit Surge Trader system here.
***********************************************************************************************************************************
Investing Wizard Who Turned $37K Into $2.7M in Just 4 Years Makes His Next Big Move
| |
He started from nothing and became a multimillionaire…
He’s now one of the most sought-after trading experts…
Yet he operates 858 miles from Wall Street.
And now, he’s revealing his #1 favorite strategy that targets MASSIVE weekly profits with just one stock ticker.
************************************************************************************************************************
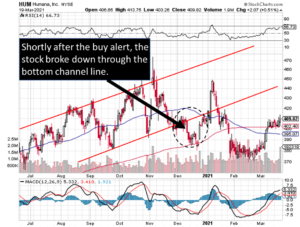
Trade 3: $HUM
Humana Inc. (NYSE: HUM) together with its subsidiaries, operates as a health and well-being company in the United States, offering medical and supplemental benefit plans to individuals.
Action to Take: Buy Humana Inc. (NYSE: HUM) between the bid and the ask. Options traders can buy the February $420 calls between the bid and the ask.
My price target on the stock is $450.
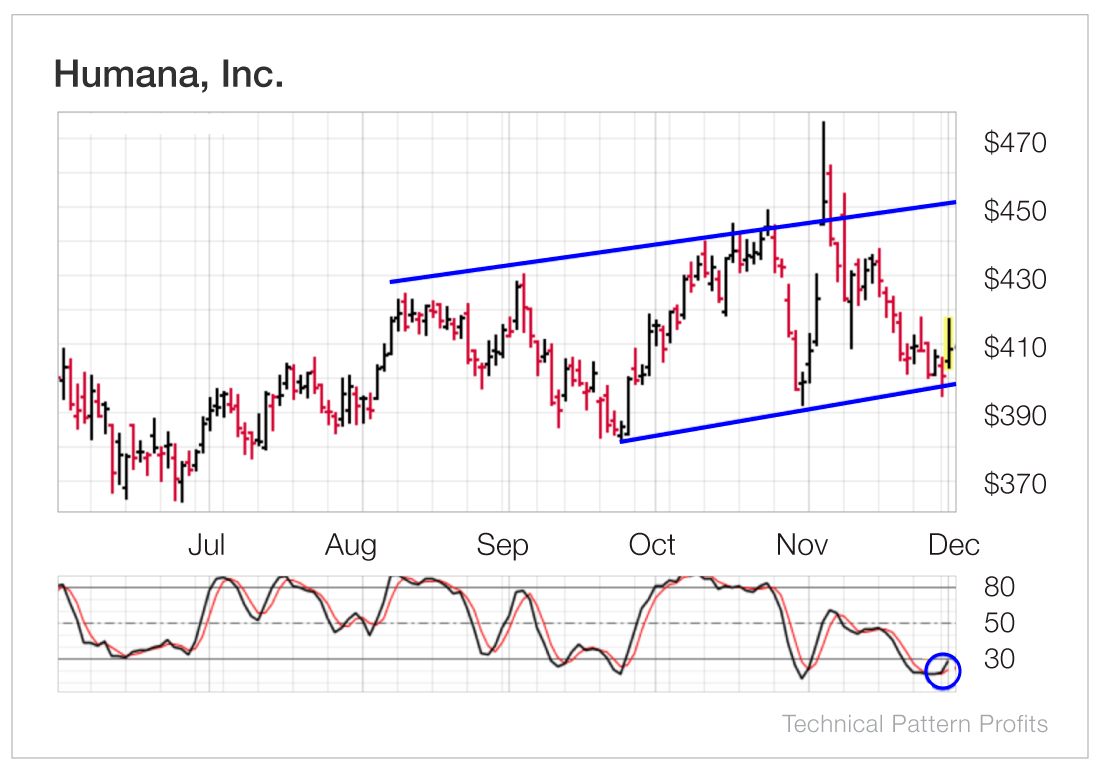
There doesn’t seem to be any stop loss prices given. Perhaps its assumed that if the bottom support line of the channel is broken, then you stop out.
This happened in the trade above. Subscribers should have stopped out if they followed the rules.
The alerts in the last 1-2 months have been interesting. It appears that Marc will also buy stocks that are breaking out through the top of a channel.
This was recently demonstrated on Feb 21st with the $DE stock.
Here was the alert….

Then they issued a buy signal 3 weeks later when the price was in the $370’s.
“Deere & Co. is a big winner for us, with a double-digit gain in the stock and a 112% profit on the calls in just over three weeks”
So yeh, they also buy channel breakouts.
Looking through the other recent alerts I see that $CVS was alerted on March 8 and 3 weeks later it has bounced from $68 to a high of $75 which is a move from the bottom of the channel to the middle. Not bad….a sell alert was issued about 10 days after the alert to sell $CVS around the $74, despite the price being mid channel. The reason stated was that the stochastic indicators were showing it was overbought and thus sensible to take profits early.
$BYND was alerted from Feb 24 to March 18 for a 5% – 10% loss.
$JD was alerted as a buy on March 2nd. 3 weeks later it is significantly lower. In my opinion the channel pattern is broken but there is no sell alert yet.
Limited Time Deal to Purchase Nate Bear’s Profit Surge Trader ASAP HERE
You can also watch a full interview with Nathan Bear discussing the Profit Surge Trader system here.
***********************************************************************************************************************************
Investing Wizard Who Turned $37K Into $2.7M in Just 4 Years Makes His Next Big Move
| |
He started from nothing and became a multimillionaire…
He’s now one of the most sought-after trading experts…
Yet he operates 858 miles from Wall Street.
And now, he’s revealing his #1 favorite strategy that targets MASSIVE weekly profits with just one stock ticker.
************************************************************************************************************************
Bullseye Trades: Best Alerts Service
Every Monday at the market open, Jeff sends you his weekly Bullseye Trade.
2022 has been AMAZING for these Bullseye Trades!
(+50% to 300% per week in my experience)
LEARN HOW TO WIN 90% OF YOU TRADES IN 90 SECONDS!
>> CLICK HERE TO LEARN MORE! <<
Oxford Club Technical Pattern Profits Review: Conclusions
I like the simplicity of the channel pattern advocated by Marc. However, the market has been terrible for long-biased traders recently and my initial impression is that the channel pattern is not holding up as often as it might in a good market. This is possibly reflected in the relatively low win rate over the last few months.
I will keep this article updated as I take more of the trades in this service. I do love the channel pattern and have used it before I joined this service. It is a solid way to make money in the markets.
My main concern is the cost. It costs a whopping $10,000 for a year subscription. You can read more about it here.
Russell
Limited Time Deal to Purchase Nate Bear’s Profit Surge Trader ASAP HERE
You can also watch a full interview with Nathan Bear discussing the Profit Surge Trader system here.
***********************************************************************************************************************************
Investing Wizard Who Turned $37K Into $2.7M in Just 4 Years Makes His Next Big Move
| |
He started from nothing and became a multimillionaire…
He’s now one of the most sought-after trading experts…
Yet he operates 858 miles from Wall Street.
And now, he’s revealing his #1 favorite strategy that targets MASSIVE weekly profits with just one stock ticker.
************************************************************************************************************************
Related Articles
Paul Mampilly Profits Unlimited Review

Leave a Reply